CAGES (Computer Aided Grouting Evaluation Software) is a real time monitoring and data acquisition program developed by ECO Grouting Specialists Inc., to monitor grouting operations and to assess the apparent permeability of the medium being grouted. CAGES performs these two functions in real time which enables the director of the grouting operation (Engineer or Contractor) to continually evaluate the effectiveness of a grouting program and the suitability of the selected grout formulation for the medium being grouted. CAGES monitors the evolution of the grouting operation over time by recording and interpreting the pressure and flow data for each grout hole/grout stage.
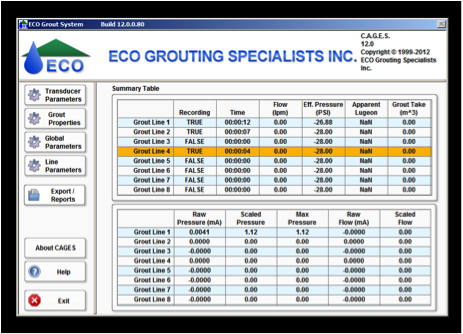
Figure 1: CAGES 12.0 Main Screen
Key Features of CAGES 12.0:
Simultaneously performs real time monitoring and assessment of up to 8 injection lines.
Provides an easy to use graphical display of pressure vs. time, flow vs. time, apparent lugeon value vs. time, as well as displaying real time grout spread and cumulative grout volume injected.
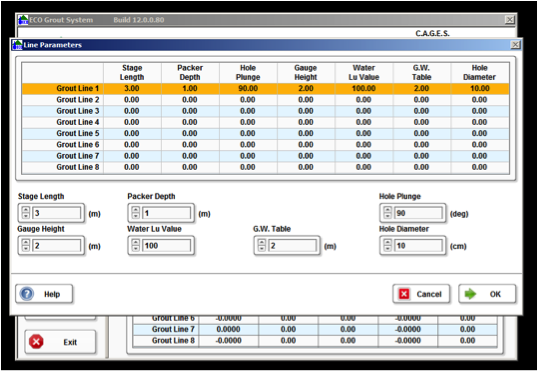
Simple input screens allow users to quickly and easily input and change information about grout formulations, grout hole numbering, instrumentation settings and geologic reference information.
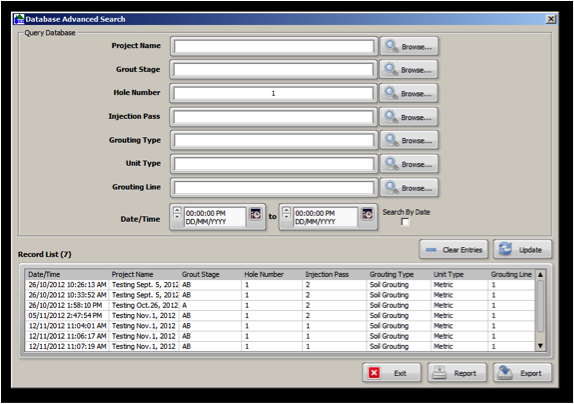
All data is easy to search and access using the CAGES database, and is stored in files as a permanent record of the grouting operation.
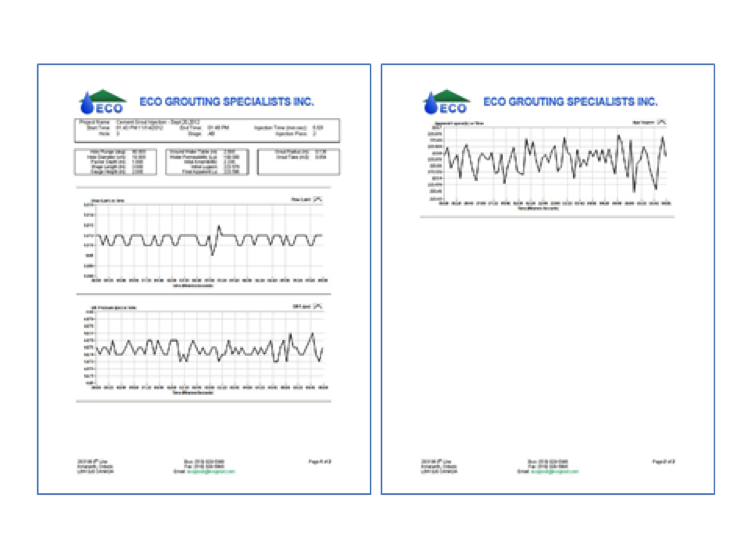
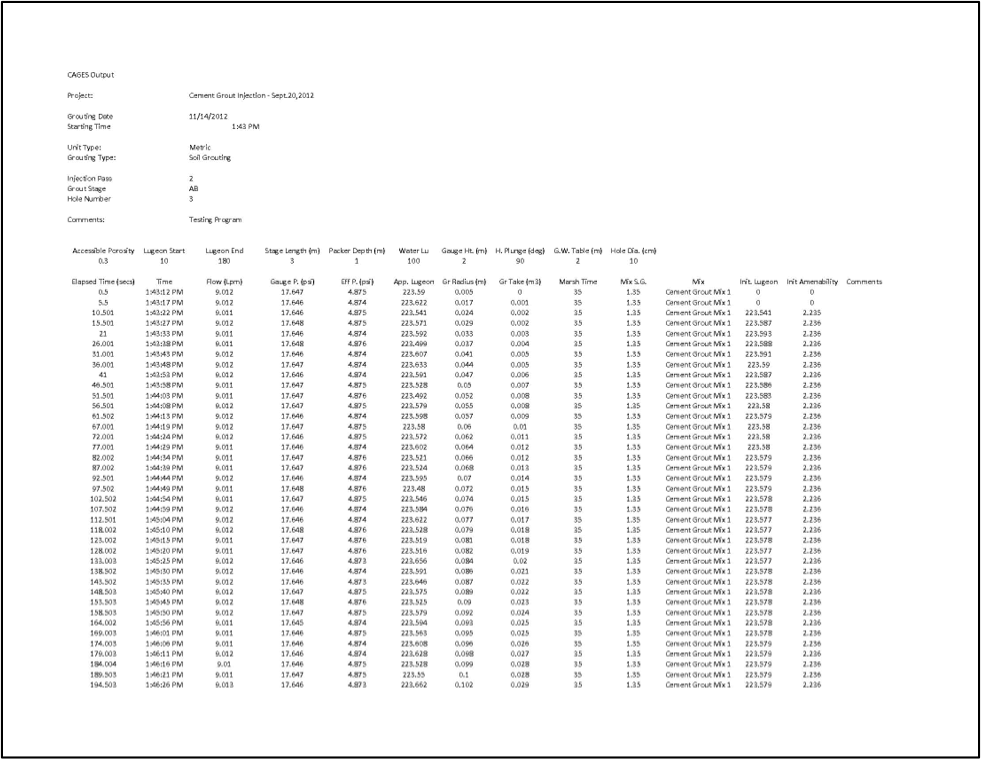
The reporting feature allows the user to easily create PDF summary reports for each grout hole and/or grout stage.
Advantages of CAGES 12.0:
Produces a more efficient and effective grouting operation. Obtaining more information in real time from the formation, results in better knowledge being obtained and allows the operator to react immediately to changes in the formation.
Provides a significant cost savings by reducing the amount of time spent pumping unsuitable grout formulations. The information needed to assess the suitability of a grout formulation for a particular formation can be obtained in easy to use graphical displays from one simple output screen.
Determines the initial amenability, initial Lugeon and final Lugeon values of a formation.
Reporting time is reduced as CAGES’ reporting feature allows summary reports to be quickly and easily developed.
Multiple hole grouting techniques allow for more volume to be injected per shift, which results in shorter project duration.
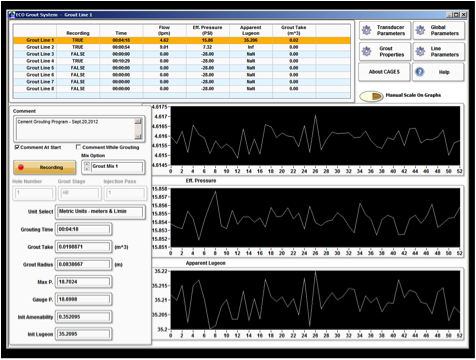
Figure 2: CAGES 12.0 Line Monitoring Screen
How It Works
The goal of many grouting operations is to reduce the permeability of the formation from an undesired initial point to as low as possible, preferably zero. CAGES allows the user to track and assess this process in real time.
Amenability Theory
CAGES evaluates the amenability of the formation to be grouted and assesses the apparent permeability of the formation with time. Prior to grouting, the permeability, or Lugeon value (Lu), of the formation to be grouted is determined by performing an in-situ hydraulic
conductivity test (IHCT). A Newtonian fluid (water) is used as a test fluid and the total aperture size (intersecting the borehole) accessible to water (Lu¬¬water) is calculated. Lu¬¬water in turn is related to the total aperture width per metre of drill hole.
During the initial stages of grouting, the Lugeon value for the same formation is determined with the Binghamian fluid (grout) as a test fluid (Lugrout). The ratio of the Lugeon values (Lugrout / Lu¬¬water) is referred to as the amenability coefficient (Ac). The amenability of a formation refers to what percentage of pores that are accessible by water are also accessible by grout. This initial information is vital to the engineer in assessing whether the appropriate formulation is being used in the grouting operation.
The Ac also gives the grouting engineer an indication of the residual permeability which can be expected in a formation using a particular grout. The difference between Lu¬¬water and Lugrout is the apparent residual permeability of the formation. For example, if the Ac is 0.75, then the apparent residual permeability will be approximately 25% of the initial permeability determined by the in-situ hydraulic conductivity test (IHCT).
If the Ac is too low or if Lugrout is decreasing sharply, then the engineer can adjust the formulation to decrease the particle size (e.g. switch from regular cement based to microfine cement based grout or microfine cement based grout to solution grout). Conversely, if the Ac is high or if the Lugrout increases during the grouting program, then the engineer can adjust the formulation to increase the solids content and/or the thixotropic properties of the grout.
Figure 3: Typical CAGES 12.0 Summary Report
Figure 4: CAGES 12.0 Database Search Screen
Multiple Hole Grouting
The economic advantages of using CAGES and the amenability theory are compounded with the ability to perform multiple hole grouting. Zones with similar permeability are grouted simultaneously until the apparent Lugeon value has been reduced to a level similar to the other zones. At that time the other zones are brought on line and a grout formulation which is suitable for all zones can be used. CAGES makes this very easy for the experienced grouting engineer to assess.
CAGES improves the quality and verifies effectiveness of grouting operations regardless of the size of the project. The implementation of real time monitoring allows for fast, easy and accurate interpretation of key grouting parameters, which makes tracking and changing the grouting operation rapid, effective, and accurate.
CAGES makes it possible for the engineer to concentrate on the assessment of the displayed information rather than on the number crunching. CAGES is continuously calculating and displaying key grouting parameters such as Lugeon value, grout spread radius and grout volume. This allows the engineer to immediately react to key responses in the formation.